Monday, December 31, 2018

Adding Date Period to SSAS Tabular Models


Using time intelligence is one of the great features of using SSAS.  I often find that it’s useful to use data periods with dashboard objects instead of simple data ranges. For example, if you want to filter the data by the last 7 days, you often have to specific the current date and the last seven days. This would be try as well for current month. To simplify this process, I would suggest creating a date period for common date selections. For the date period as follows...


  • Current Month
  • Last Two Months
  • Last Three Months
  • Last Six Months
  • All Periods
In this example, the date column is Fiscal Week (Typically this would be Date Column) and the Date is specific as FiscalDate. The ‘Fiscal Week’[FiscalDate] columns would need to be change to whatever is correct in your SSAS model (i.e ‘Date’[Date]’).

You would first simply create a Calculated Table in your Tabular Model with the following DAX Query: 

= UNION (

ADDCOLUMNS( SUMMARIZE( CALCULATETABLE('Fiscal Week' , DATESBETWEEN('Fiscal Week'[FiscalDate], EOMONTH(TODAY(),-1)+1,TODAY())  ), 'Fiscal Week'[FiscalDate]),"Period","Current Month") ,

ADDCOLUMNS( SUMMARIZE( CALCULATETABLE('Fiscal Week' , DATESBETWEEN('Fiscal Week'[FiscalDate], EOMONTH(TODAY(),-2)+1 ,TODAY())  ), 'Fiscal Week'[FiscalDate]),"Period","Last Two Months") ,

ADDCOLUMNS( SUMMARIZE( CALCULATETABLE('Fiscal Week' , DATESBETWEEN('Fiscal Week'[FiscalDate], EOMONTH(TODAY(),-3)+1 ,TODAY())  ), 'Fiscal Week'[FiscalDate]),"Period","Last Three Months") ,

ADDCOLUMNS( SUMMARIZE( CALCULATETABLE('Fiscal Week' , DATESBETWEEN('Fiscal Week'[FiscalDate], EOMONTH(TODAY(),-6)+1 ,TODAY())  ), 'Fiscal Week'[FiscalDate]),"Period","Last Six Months") ,

ADDCOLUMNS( SUMMARIZE( CALCULATETABLE('Fiscal Week'), 'Fiscal Week'[FiscalDate]),"Period","Overall") )


 In this example, we could use data periods by days as well…

  • Last 7 Days
  • Last 14 days
  • Last 30 days
  • Last 90 days
  • All Periods 
= UNION (

ADDCOLUMNS( SUMMARIZE( CALCULATETABLE('Fiscal Week' , DATESBETWEEN('Fiscal Week'[FiscalDate],today()-07+1,today()) ), 'Fiscal Week'[FiscalDate]),"Period","Last 07 Days") ,

ADDCOLUMNS( SUMMARIZE( CALCULATETABLE('Fiscal Week' , DATESBETWEEN('Fiscal Week'[FiscalDate],today()-14+1,today()) ), 'Fiscal Week'[FiscalDate]),"Period","Last 14 Days") ,

ADDCOLUMNS( SUMMARIZE( CALCULATETABLE('Fiscal Week' , DATESBETWEEN('Fiscal Week'[FiscalDate],today()-30+1,today()) ), 'Fiscal Week'[FiscalDate]),"Period","Last 30 Days") ,

ADDCOLUMNS( SUMMARIZE( CALCULATETABLE('Fiscal Week' , DATESBETWEEN('Fiscal Week'[FiscalDate],today()-90+1,today()) ), 'Fiscal Week'[FiscalDate]),"Period","Last 90 Days") ,

ADDCOLUMNS( SUMMARIZE( CALCULATETABLE('Fiscal Week'), 'Fiscal Week'[FiscalDate]),"Period","Overall") )

 Once you’ve created the Calculated Table, you must add a relationship to the Date Table in your model. In this example, we create the relationship with the Date Period calculated table in the a Table called Fiscal Week. We simple use the default Cardinality: One to Many for the Filter Direction, we use Both Tables.
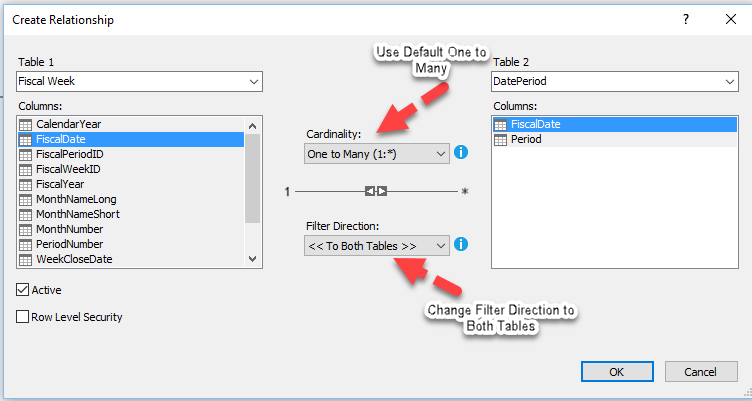


Select OK to save and after deploying the model you should be able to filter by periods.

Friday, January 26, 2018

Dynamic Update of Date Timestamps

When working with data warehouses, it's common to encounter scenarios where you need to track changes over time. One such situation is when you want to add timestamps to your data tables to record when data was added or modified. This can be especially useful for troubleshooting and reporting purposes.

Here's a sample query that demonstrates how to add a new timestamp column and update it when new data is inserted:

 -- Add a new column and insert the default timestamp when added

ALTER TABLE dbo.TableName ADD NewColumnName datetime
ALTER TABLE dbo.TableName ADD DEFAULT (getdate()) FOR NewColumnName

By following this approach, you can efficiently track when data was added or modified without having to recreate the entire table or add complex logic for timestamp management. It's a simple yet effective way to save time when troubleshooting table updates.

Remember that while adding timestamps directly to your fact tables can be convenient, it's also essential to consider other design patterns. For instance, some experts recommend having separate time and date dimensions. These separate dimensions allow you to handle different time granularities (such as hours, minutes, or seconds) more effectively. If your reporting requirements involve querying data based on specific hours or minutes, using a dedicated time dimension can be beneficial.

Adding timestamps to your data warehouse tables is a valuable practice for maintaining historical context and improving query performance. Whether you choose to include timestamps directly in your fact tables or use separate dimensions depends on your specific use case and reporting needs.

Sunday, January 21, 2018

Create Dynamic Date Periods in DAX

Date filters are a very common dimension in dashboards and here is a simple way to create dynamic date filters. This saves times as it prevents you from having to pull dates from other sources.

In other tables, I would add a DateKey as follows...

DateKey = Format('Sales[DATE],"YYYYMMDD")


Then the following...
DATES


DATE = ADDCOLUMNS( CALENDAR(DATE(2017,1,1), DATE(2020,12,31)) ,"DateKey", FORMAT ( [Date], "YYYYMMDD" ), //NumericDate
"Date2", FORMAT ( [Date], "M/d/yyyy" ),

"Year", YEAR([Date]),

"FiscalYear","FY" & IF (MONTH([Date]) <=5 ,Year([Date]),Year([Date]) +1) ,

"Quarter", "Q " & FORMAT( [Date], "Q"),

"MonthNameLong" , FORMAT ( [Date], "mmmm" ) ,

"MonthNameShort" , FORMAT ( [Date], "mmm" ) ,"Month Key", FORMAT ( [Date], "YYYYMM" ),

"MonthNumber", MONTH([Date]),

"MonthYear", FORMAT ( [Date], "mmm " ) & YEAR([Date]), "Month Year 2", FORMAT ( [Date], "mmm " ) & RIGHT(YEAR([Date]),2),

"DayName", FORMAT ( [Date], "dddd" ), //Name for Each day of the week

"DayShortName", FORMAT ( [Date], "ddd" ),

"DayNumber" , WEEKDAY ( [Date] ) )

DATE PERIOD


 DatePeriod = 

UNION (

ADDCOLUMNS( SUMMARIZE( CALCULATETABLE('Date' , DATESBETWEEN('Date'[Date],today()-07+1,today()) ), 'Date'[Date]),"Period","Last 07 Days") ,

ADDCOLUMNS( SUMMARIZE( CALCULATETABLE('Date' , DATESBETWEEN('Date'[Date],today()-14+1,today()) ), 'Date'[Date]),"Period","Last 14 Days") ,

ADDCOLUMNS( SUMMARIZE( CALCULATETABLE('Date' , DATESBETWEEN('Date'[Date],today()-30+1,today()) ), 'Date'[Date]),"Period","Last 30 Days") ,

ADDCOLUMNS( SUMMARIZE( CALCULATETABLE('Date' , DATESBETWEEN('Date'[Date],today()-90+1,today()) ), 'Date'[Date]),"Period","Last 90 Days") ,

ADDCOLUMNS( SUMMARIZE( CALCULATETABLE('Date'), 'Date'[Date]),"Period","Overall") )


 Once you create both date and date period tables, you can need to join these together using Manage Relationships. Make sure you specific to Both for Cross Filter Directions.