Timeout expired. The timeout period elapsed prior to
completion of the operation or the server is not responding.
If you've worked enough with report and database development
you will have your share of timeout occurrences. There are many discussions on
timeouts but I've seen very little to explain the layers of timeout settings
that are enacted when you run a report. At its core, timeout settings from a
report execution perspective occur at the following levels...
- At the dataset level
- At the data source level.
- At the database server level
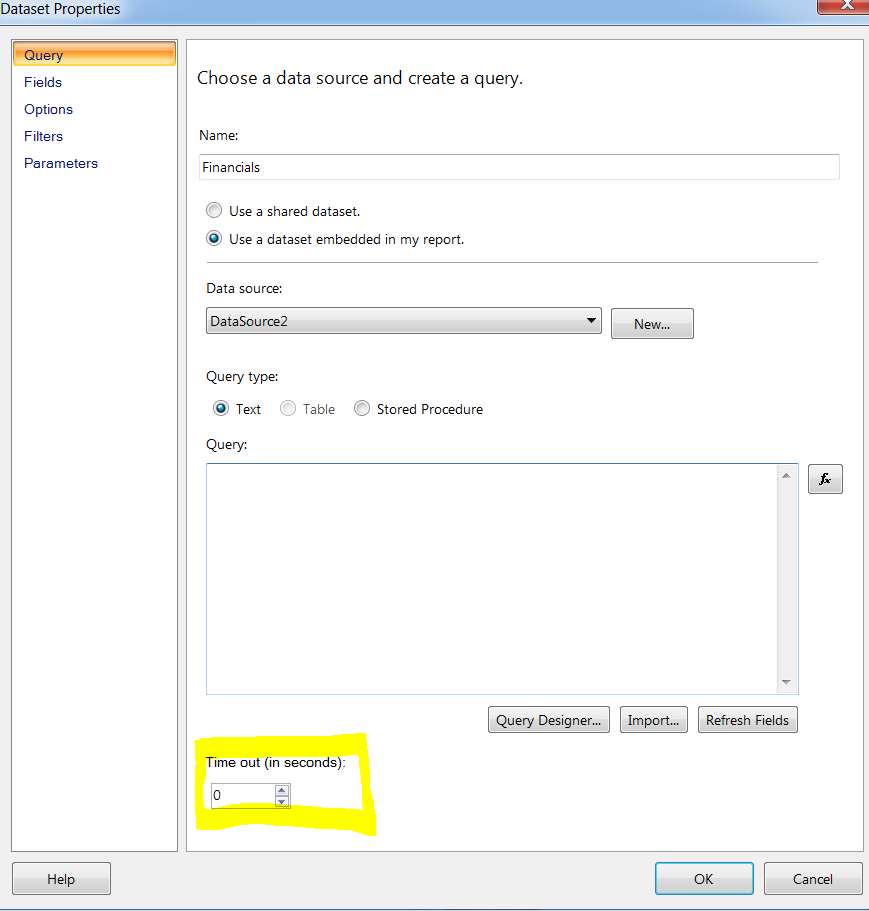
At the dataset level
As a report developer, this is one area that you have a lot
of control on the timeout setting if the dataset is embedded. By default, this
setting is 15 (in seconds). So if when running the report, you have issues
connecting to the dataset, this is where the timeout will occur. This is
generally not the real source of timeout issue because the connection to the data
source should be instantaneously. Regardless, the setting is shown below.
At the data source
level

If you make the change in the advanced settings (thus
changing the default setting), you will then notice that the connection string
has added the timeout setting. It will be added as “Timeout Connection = X“ . This
is the same as Timeout = X which you’ll commonly see in Connection Strings.
At the database
server level
Typically not a report designer responsibility but it you
need to change it (or inform your DBA) you can specify this at the SQL Server Level
- meaning this will impact all databases on the server. You find this in the
properties setting the SQL Server. Now if you are using another type of data
source, you’ll need to find out where that is change (I only talk about SQL
Server here).

Shared data sources
and datasets
If you are using shared Data Sources or datasets, you will
then need to have access to the location of these objects to check or change
the timeout value. The settings have the
same principles as embedded versions but are simply stored at the SSRS Website.
You simply have to specify Manage on the required object. For datasets you can
change it here…

Or for the Data Source, use the following location.

Using this information should be all you need to isolate the
source of failure for the Timeouts issues you experience when running and
developing reports.