Friday, November 20, 2015

Power BI DAX Calculations


I use Power BI a lot. Particularly lately I’ve been using the Power BI Desktop that Microsoft seems to be updating almost weekly (Just kidding, but it is on about a monthly update schedule).  When creating calculations, I find some of the most impactful calculations are YTD, Same Period Last Year, and % of Total.

To save you some time, here are the Measure Calculations.... 

·     % of a Total
 
% of Total  = SUM(DailySales[Net Sales]) / CALCULATE(SUM(DailySales[Net Sales]),ALLSELECTED()) 

·     Year to Date
Basically, we need to make sure the Date is format as a normal Date. 

Net Sales YTD = TOTALYTD(SUM(DailySales[Net Sales]),Dates[Date])

·     
            Sales of the Previous Year
Net Sales PY = CALCULATE(SUM(DailySales[Net Sales]), SAMEPERIODLASTYEAR(Dates[MonthYear])) 

Using these three expression you can easily modify these to accommodate other time intelligence calculations and percentages.So if you wanted to get the % change of the Previous Year, you can use the above measure as follows:
         % ChangeVSLastYr = ((SUM(DailySales[Net Sales]) / [Net Sales PY])) - 1

Friday, August 28, 2015

Find Column Names across a SQL Database


When working against databases that you’re not particularly familiar with and you don’t have a data dictionary (or any schema information) you often need to have a quick way to find column names in a database.  
Using this query I created, you can specify a value for the @FindColumn parameter and it will look for that column using the database of your choice. In this example, I looking for the 'clientkey' across the database ProdDB.
 
-- FIND  clientkey columns in SQL Database ProdDB--
 
Use ProdDB
Declare @FindColumn varchar(32)
SET @FindColumn = 'clientkey'

 
SELECT t.Name AS TableOrViewName, [type_desc] [Type],
SCHEMA_NAME(schema_id) AS [Schema],
c.name AS ColumnName
FROM sys.tables AS t
INNER JOIN sys.columns c ON t.OBJECT_ID = c.OBJECT_ID
WHERE c.name LIKE @FindColumn

UNION

SELECT v.name,type_desc, SCHEMA_NAME(schema_id) AS [Schema] , cl.name
 FROM sys.views v
 INNER JOIN sys.columns cl ON v.OBJECT_ID = cl.OBJECT_ID
 WHERE cl.name LIKE @FindColumn 

 ORDER BY [Schema], TableOrViewName


Monday, June 29, 2015

Common Date Calculations for Parameters and SQL variables


I’m commonly asked to make the parameters for the date start with specific months. I’m typically asked for its First Day Last Month or Last Day Previous Month. Here are the T-SQL and SSRS Expressions to create the dates:
Using T-SQL:
--First Day of Current Month
SELECT DATEADD(mm, DATEDIFF(mm, 0, GETDATE()), 0)

--Last Day of Current Month
SELECT DATEADD (dd, -1, DATEADD(mm, DATEDIFF(mm, 0, GETDATE()) + 1, 0))

 --First Day of Previous Month
SELECT DATEADD(mm, DATEDIFF(mm, 0, GETDATE()) - 1, 0)

--Last Day of Previous Month
SELECT DATEADD(DAY, -(DAY(GETDATE())), GETDATE())
 
When you need to create these directly in the SSRS Report. Use the following:
 
--First date of Current Month
=Today.AddDays(1-Today.Day)

 --last date of Current Month
=Today.AddDays(1-Today.Day).AddMonths(1).AddDays(-1)

 --First date of Current Year
=Today.AddMonths(1-Today.month).AddDays(1-Today.day)

 --Last date of Current Year
=Today.AddDays(1-Today.Day).AddMonths(13-today.month).AddDays(-1)

 --Previous Month Last Date
=DateAdd("d",-(Day(today)), Today)

--Previous Month First Date
=dateadd(dateinterval.month, -1, today().AddDays(-(today().Day-1)))

Monday, April 6, 2015

Creating Environments for Testing

I’ve said during rants about career options, building a lab to test is essential to your development as an IT professional. I‘ve pointed out where you can find a treasure-trove of IT books (http://it-ebooks.info/) and also where you can get free training (Microsoft Virtual Academy).  Using these two site resources you get the books and the training, now you can use the Microsoft Virtual Labs to get to play around with the technologies you read and learned.

Now the third part of your learning process should stem around practicing what you have learned. I’ve said in previous posts that you should establish a lab to test learned technologies so that you when you need to execute them in the real world, you’ll be more effective. Testing requires having some lab environment that mimics the real world. Unfortunately, this is where you can run into a few challenges trying to establish the appropriate environment. This is why I recommend using the Microsoft Virtual Labs - https://technet.microsoft.com/en-us/virtuallabs

Using Microsoft Virtual Labs

The main advantage is that is provides a ready-made environment so that you can practice what you learned.  You don’t have to spend any time setting up a test environment which is often the most laborious and costly side of testing. I’ve worked in support for a long time (too much in my opinion) and the need to have available environment to test customer issues that critical to understanding a resolving customer issues.
It can be costly and very time consuming to have enterprise solutions like SharePoint is testing format. Even if you are using virtual solutions (Hyper-V or VMWare), this is still an expensive technology because it takes lots of disk space and memory (RAM). This does not include the processing power needed to effectively run a “usable” installation. Sure you can get by using these methods with a simple SQL solutions or even a barebones SharePoint environment, but those are often not the best environment to test solutions that are of the enterprise variety.
One of the only downsides is that each virtual lab environment is that is expires in 90 minutes. That may not seem like a long time but it is generally sufficient to test when the all configuration has been done. The obviously con is that if you build out a lab environment with a lot of configuration that will be lost.  Therefore, it’s important that you factor that restriction in your testing. This is for testing issues that can be reproduced quickly or for learning and not for testing solutions that require hours to produce.


Friday, March 6, 2015

Creating a Azure SQL Server Reporting Portal for Public Usage

I love using Windows Azure.

This technology saves you a lot of time when it comes to deploying Microsoft server technology. No longer do we have get a physical server, install all the appropriate hardware, install the all the software, configure the software, and not to mention the security, change control, governance, etc. and all that is required to get just the server up and running.  With Windows Azure, you simply need to just open up the Microsoft Azure portal and create the appropriate virtual machine and pick the required template. Tasks that used to take day can now be done in an hour.
Making your SQL Azure server available for Internet users essentially consists of the following two tasks:
  1. Opening HTTP/HTTPS endpoint for your VM in Azure management portal (or during the installation of the VM)
  2. Establish a firewall port on the VM (After the VM has been installed)
The process is as follows...

First we have to create a Virtual Machine for the SQL Server. You can use any SQL Server version as all have the SQL Reporting Services components installed.


Next, when creating your VM, machine sure you add the option to connect via HTTP. This is done by adding the HTTP endpoint. You can specify a Private and Public port (80 is the default for HTTP).


Continue until the provision completes (i.e. Creating Virtual Machine,). Depending on the size of the VM (in this example I’m creating a SQL Server Web Server), it should take about 20 minutes to an hour. You have to establish the SQL Reporting Services as by default, the URL, Manager, and the Reporting database is not installed (version SQL 2014).
Open Windows PowerShell on your Virtual Machine and open a port so this VM is available for Internet users.
                 i.          Open a command windows (cmd.exe)
                ii.          When the command widows opens, run PowerShell (Powershell.exe)
               iii.          Run the following command via PowerShell on the Virtual Machine:

New-NetFirewallRule -DisplayName “Report Server Name”-Direction Inbound –Protocol TCP –LocalPort 80

Open the SQL Services Reporting Configuration Manager to now configure the SQL Reporting Service. First open up the tool and Connect to the existing SQL Server. Next establish the SSRS Web Service URL…

 
Next establish the SSRS Web Service URL…
 
Make sure you create the database next. Follow the wizard and input the required information. This is a straightforward process that will either create a new database or use an existing one. I would suggest creating a new one as it is a lot easier.


Next create the actually SSRS Reporting Portal that you will typically use to upload your reports.


Once you have enabled / installed the SQL Reporting Database, the Report Server websites, you can now connect directly via a browser to the server. You will have to use the fully qualified domain name (FQDN) as follows:

<Servername>.cloudapp.net/reports  (*.cloudapp.net is the default Azure DNS)

You can now have users connect to the reports, develop reports and use other SQL Reporting tasks that you normally accomplish via a SQL Server on your premises.


Creating PowerPivot data sources


As I have demonstrated there are a lot of things about PowerBI to get excited about. One of these is Microsoft’s adaption of the technology xVelocity. The true power behind PowerPivot is the xVelocity in-memory analytics engine.
Why XVelocity is important

Before Microsoft’s introduction of xVelocity most of the report offerings was via SSRS, ASP.NET, and Performance Point Services. SSRS an ASP.Net uses a lightweight development model. These visualization tools relied on data sources like SQL Server that traditionally was stored on hard disks.  Hard disks are relatively slow. Whenever system must use resources stored on disk, this will impact the response time of the report or dashboard. This is why Microsoft now uses xVelocity.  xVelocity gives you two very important things, faster dataset creation (via PowerPivot) and the faster response from visualization tools that rely on these datasets.
PowerPivot as a data source
The power to create PowerPivot data sources cannot be understated. With this technology you can create a centralized data source that encompasses various data sources. You can create a PowerPivot data source that is comprised of text files, Excel worksheets, and database tables into one data source. In my example, I’m going to demonstrate how to do this with SQL Server. PowerPivot data source differ from others because its dataset is stored entirely in memory. Again, this is due to the xVelocity technology.

PowerPivot is essentially the database “Tabular” model

Tabular model is a database design much like OLAP Cubes. However, Tabular cannot totally replace MDX cubes. The main reason is due to the memory requirements for tabular. Tabular models must be stored in memory while MDX can be stored on physical disks, essentially allowing an extremely large data sources. Unfortunately, the MDX language is more difficult to use and the OLAP cube development can be much more frustrating.  DAX, which is the expression language of Tabular/PowerPivot data sources, is easier to use and understand. Excel users will find DAX easy to adapt because of its familiarity to Excel expressions.

Thursday, February 12, 2015

That annoying timeout error

Timeout expired.  The timeout period elapsed prior to completion of the operation or the server is not responding.

If you've worked enough with report and database development you will have your share of timeout occurrences. There are many discussions on timeouts but I've seen very little to explain the layers of timeout settings that are enacted when you run a report. At its core, timeout settings from a report execution perspective occur at the following levels...
  • At the dataset level
  •  At the data source level.
  •  At the database server level
Therefore, when you receive a timeout, these are the three areas that you need to check.

At the dataset level

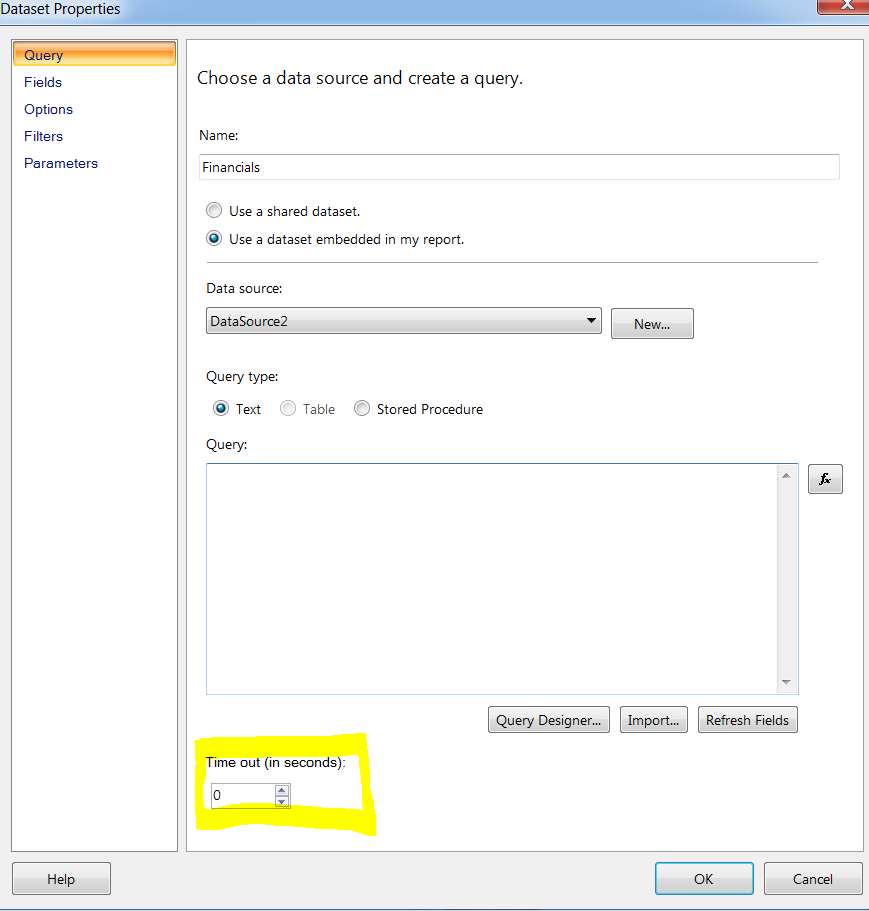
As a report developer, this is one area that you have a lot of control on the timeout setting if the dataset is embedded. By default, this setting is 15 (in seconds). So if when running the report, you have issues connecting to the dataset, this is where the timeout will occur. This is generally not the real source of timeout issue because the connection to the data source should be instantaneously. Regardless, the setting is shown below.


At the data source level
Again, if the data source is not shared, this is an easy change by the report developer. By default, this setting is 0 (unlimited). You can find this location at the following location.


If you make the change in the advanced settings (thus changing the default setting), you will then notice that the connection string has added the timeout setting. It will be added as “Timeout Connection = X“ . This is the same as Timeout = X which you’ll commonly see in Connection Strings.

At the database server level
Typically not a report designer responsibility but it you need to change it (or inform your DBA) you can specify this at the SQL Server Level - meaning this will impact all databases on the server. You find this in the properties setting the SQL Server. Now if you are using another type of data source, you’ll need to find out where that is change (I only talk about SQL Server here).


Shared data sources and datasets
If you are using shared Data Sources or datasets, you will then need to have access to the location of these objects to check or change the timeout value.  The settings have the same principles as embedded versions but are simply stored at the SSRS Website. You simply have to specify Manage on the required object. For datasets you can change it here…


Or for the Data Source, use the following location.


Using this information should be all you need to isolate the source of failure for the Timeouts issues you experience when running and developing reports.

Wednesday, February 4, 2015

Self-Service BI with PowerView

 
In an attempt to empower the users, Microsoft has launched several tools that allow users to develop their own data visualization efforts. Excel, a familiar tool that has a large audience is one of the suite of tools that you can use to develop impressive reports and dashboards. Using Excel, you can create PowerView reports.  PowerView visualizations are authored in the Excel environment which helps remove  a “barrier on entrance” for users  who can be skeptical of using unfamiliar report development tools.  PowerView is one of Microsoft self-service BI tools (Power Query and Power Map are the others) that make up its self-service BI offering. It allows for some very impressive data exploration and intuitive ad-hoc reporting. 

Before embarking on these self-service BI tools, it’s important to first understand the importance of PowerPivot. PowerPivot has been available for Excel 2010 as an add-on and it is a core component of all Microsoft BI self-service tools. PowerView reports are based on PowerPivot models in Excel. In order to use PowerView, you must first establish a PowerPivot Worksheet. In order to create a report, open the Excel workbook that contains a model and on the Insert tab, click the Power View button

To help drive home the point of self-service BI ease of use, I have created a video that demonstrates producing a PowerView dashboard...


As you can see in just a few clicks,  I was able to create a relatively impressive representation of data without the assistance of IT staff or some data steward. 

Although its an easy environment to create reports, as with any reporting tool, it’s still important to understand how to best represent you data given business questions that need to be answered and audience. These tools won't make you report designer guru with just a few clicks. However, for those that know what they want from their data , PowerView will help you get there very fast and without much assistance.

Monday, January 26, 2015

SharePoint Lists as Data Sources

One of the newer methods used as a data source are SharePoint Lists. SharePoint lists as data sources one of the newer methods of data sources is the SharePoint Lists. Although this type of data source removes the need of an available database for you reports, conversely, it removes the available of useful database features as well.  Connecting to a SharePoint lists is very easy. That is one of the advantages of using this type of data source. It’s typically an HTTP URL such as the following...

Though SharePoint lists have one of the simplest methods of connections, it also provides one of the most costly drawbacks in the inability to develop useful queries against the SharePoint lists. This becomes a bigger issue when you are using multiple SharePoint list in the report and data needs to be joined across different lists. Unfortunately, there is no natural JOIN syntax that you can use in the Visual Studio/Report Builder query designer that will allow you to join two different SharePoint Lists into one query/dataset. Therefore you must create multiple datasets and join them using the combination of the SQL Expression Language commands.
For example, if we had three different SharePoint Lists as follows...


In this example if we had to display the Customer with the Sales total, we would have to join the Sales List to the Location List and eventually to the Customer List. This is easy to do in the typical relational database with a simple join command.  Again, since we can join SharePoint lists within the query builder, we have to rely on the SSRS expression language for make these connections. To accomplish this we using the following SSRS functions LookupSet , Join and ReportItem syntax (since we must join a to a third list).
If we simply joining the Sales List to the Location List, all we have to do is use the LookupSet function as follows.

=Join(LookupSet(Fields!LocationID.Value, Fields!LocationID.Value, Fields!CustomerID.Value, “Location”)
If we must connect to the third Sharepoint Customers to get the Customer Name, we have to use the ReportItem expression. This is because you cannot use nested LookupSets in the SSRS Expression language. There use are required to then using the above command to create the CustomerID value to display in a Tablix, Matrix, or List, and then using the ReportItem to use that one of the values in another LookupSet Expression. So if we have already created a ReportItem for the CustomerID using the above expression, then we are using the following to pull in Customer name.
=Join(Lookupset(ReportItems!CustlocID3.Value,Fields!CustomerID.Value,Fields!LastName.Value,"Customers"))

In this expression we use the CustlocID3 that is the ReportItem name in the Tablix (You can find the name of the textbox in the general sections of the Tablix (or Matrix) properties.
Microsoft ability to allow SharePoint Lists as a data source adds some real advantages for enterprise customers. This is particular true is you need some centralized data source but the IT department won’t give out another DB license or access. SharePoint Lists has some great advantages but to get around some of the major drawbacks it will require you to use more of the SSRS expression language .

Friday, January 2, 2015

Becoming an IT professional

The IT industry offers excellent earning potential and presents very few barriers to entry. With average reasoning abilities, sound reading comprehension, and some patience, anyone can enter the field and become employable. Your success in the industry will largely depend on your ambition and area of specialty. As the industry continues to grow, there is a constant need for more IT professionals. While some believe that the market is saturated, my experience and the industry as a whole suggest otherwise. Any credible list of "Top Industries in the Future" should include IT (particularly programming) as a growth industry.

I have worked in the IT industry for over 20 years and have never seen a shortage of work or ideas that need implementing. To enter and thrive in this industry, there are four essential things to consider: get technical, avoid being non-technical, continue to learn, and learn to research.

Getting technical requires choosing a specialty and focusing on a set of technologies. Whether you decide on .Net programming, mobile development, system administration, or database development, your career path must have a focused approach. At this stage in my career, I am primarily focused on Microsoft Business Intelligence (MSBI), a growing and evolving technical area.

Avoid becoming an "administrative IT professional" by working only on IT processes instead of technology. You should understand IT processes, but focus on a specialty where you know the technology well enough to break it down at any level.

Continuing to learn is essential to staying marketable in the industry. Free technical discussion and learning sites, such as Microsoft Virtual Academy, and IT eBooks are excellent resources for continuing education. Reading books in your area of specialty with interest is essential.

Having your lab environment is crucial to practice, experiment and test. This is where your best learning will take place, allowing you to practice strategies, follow labs and exercises, and build the confidence needed to experiment in a safe environment. Virtual environments, such as VMWare or Hyper-V, are useful for creating a lab environment to practice your specialty.

In conclusion, IT is an evolving industry, and staying relevant requires continuous learning and skill improvement. Choosing an area that you are passionate about will make it easier to embrace continued learning. IT is a growth industry, and you can have a long and rewarding career if you are willing to evolve with it.

Thursday, January 1, 2015

Using Alternating Row Colors for SSRS


Outside of the making sure that reports reflect the accuracy of the data, it’s also important to make sure the reports are easy to read. One of the most effective ways to make reports easy to ready is to ensure that the visibility of data aligns with the natural way people read data – left to right and top to bottom.
Using alternating row colors not only can make the report more visually pleasing, but also simply easier to read. There are several ways to accomplish this but the most methods would working using to common SSRS expressions: RunningValue and RowNumber. RowNumber is a bit simpler and requires less values but RunningValue is more reliable.
You can use RowNumber when you are using a simply Tablix (Table) where there is no Tablix Grouping defined. Tables are a popular method for displaying data. When you have rows with many columns (8 or more) you can make the tables easier to read by adding alternating color to the rows. Even without a lot of columns, alternative row colors can still make an impactful look on columns. For example, when we look at the following column…


This example using a column where there is no grouping. Therefore, we could simply using a RowNumber SSRS Expression. This requires specifying the textbox background using the following expression to generate alternative row colors… =iif(ROWNUMBER(nothing) MOD 2,"White","Gainsboro").

Again, this method works great when we are using a Tablix that does not use group or aggregations. When using grouping, I suggest you instead try RunningValue to accomplish alternating row colors because the row number are not often sequential when using grouping. In this case I have grouped the items by Conference and then allow drill down to the Institution category.

I would suggest then using RunningValue as the method to establish the alternative columns. You would then use the following method instead
=IIF(RunningValue(Fields!Resource_No_Name.Value,CountDistinct,Nothing) Mod 2,"Silver ", "White")
Whatever type of Tablix configuration that is being used, either RunningValue or RowNumber should be part of the SSRS expression use setting alternate row colors.